User Guide
How to install FRK Levels and read every feature · Updated October 13, 2026 · Illustrations use sample data
Getting started
FRK Levels draws FRK levels, GEX support and resistance, the expected move, volume bubbles and a delta profile on your own TradingView chart. Setup takes about two minutes.
- Subscribe at frkcharts.com/levels. After checkout you choose your FRK Levels username and password.
- Download the extension from the Install tab on your account page and unzip it.
- Install in Chrome (or Edge or Brave): open
chrome://extensions, turn on Developer mode, click Load unpacked and pick the unzipped folder. - Sign in: click the FRK Levels icon in the toolbar and enter your username and password. Allow access to api.frkcharts.com when Chrome asks.
- Open a chart on tradingview.com. The levels appear on their own.
The status panel in the bottom-left corner of the chart tells you what the extension is doing:
| Dot | Text | Meaning |
|---|---|---|
| Green | Live | Levels and GEX are current |
| Amber | Connecting to feed | Loading; wait a few seconds |
| Amber | Live · GEX offline | Levels are current; GEX is temporarily unavailable |
| Red | Sign in from the FRK Levels extension icon | You are signed out |
| Red | Feed expired | The connection dropped; it reconnects on its own |
FRK levels
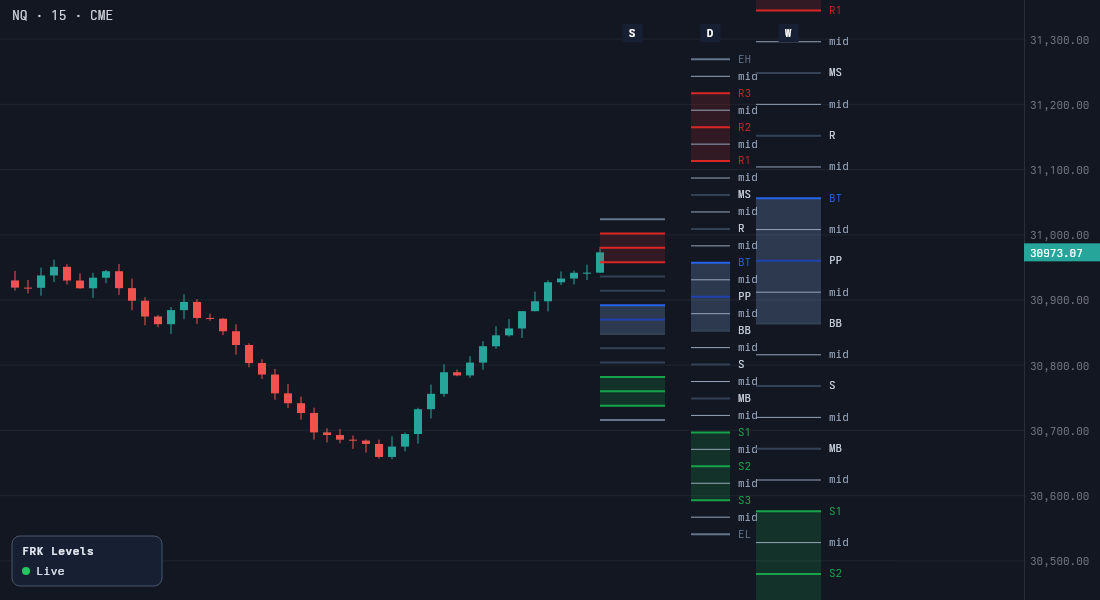
FRK draws the same ladder of levels on three timeframes, each in its own column to the right of price. Each frame recalculates on its own, driven by time, price and volatility rather than a fixed schedule, so the spacing widens in fast markets and tightens in quiet ones.
| Frame | Badge | Use it for |
|---|---|---|
| Scalp | S | The next trade, intraday swings |
| Daily | D | Swings over a couple of days |
| Weekly | W | The multi-week trend |
Each frame has the same levels, top to bottom:
| Label | Level | Role |
|---|---|---|
| EH | Extension High | Outer edge of the range |
| R3, R2, R1 | Resistance 3–1 | Sell zone; R3 is the strongest |
| MS | Mid-S | Halfway between R1 and R |
| R | Resistance | Upper reaction level |
| BT | Balance Top | Top of the balance zone |
| PP | Pivot Point | Centre of balance |
| BB | Balance Bottom | Bottom of the balance zone |
| S | Support | Lower reaction level |
| MB | Mid-B | Halfway between S and S1 |
| S1, S2, S3 | Support 1–3 | Buy zone; S3 is the strongest |
| EL | Extension Low | Outer edge of the range |
Thin grey mid lines sit halfway between neighbouring levels. Hide them per frame with the Mids checkbox; Scalp mids start hidden. Scalp also hides its labels to keep the column narrow.
Zones
Each frame shades three kinds of zone. Buy the green zone, sell the red zone, and expect two-way trade in the blue one.
| Zone | Colour | Between | How to use it |
|---|---|---|---|
| Sell | Red | R3–R2 and R2–R1 | Look for shorts; price is stretched to the upside |
| Balance | Blue | BT–BB | Fair value; expect chop and mean reversion |
| Buy | Green | S1–S2 and S2–S3 | Look for longs; price is stretched to the downside |
Overlapping zones are the strongest signal. When the Scalp buy zone sits inside the Daily buy zone, a short-term entry lines up with the bigger swing. Daily inside Weekly does the same for the larger move. The more frames agree, the stronger the level.
Views
The View menu in the popup controls how much is drawn. Start with All Levels; switch to Simple when the chart feels busy.
| View | Shows | Best for |
|---|---|---|
| All Levels | Every level, mid and zone of each frame you have switched on | Full picture, planning the day |
| Simple | Only the levels where GEX support or resistance sits | A clean chart while trading |
| Zones | The Scalp levels with GEX, each linked to the nearest Daily level | Seeing where a scalp level lines up with the swing |
| All + Zones | All Levels plus the Scalp-to-Daily links | Both at once |
A frame you switch off still draws any level where GEX support or resistance sits, so you never lose a wall.
GEX support and resistance
Live options gamma (GEX) marks the strikes where dealers hedge hardest. FRK Levels shows live GEX support and resistance highlighted on your FRK levels, so you see which levels have real options interest behind them.
| Look | Meaning |
|---|---|
| Thick hollow orange line | GEX resistance (call wall) |
| Thick hollow purple line | GEX support (put wall) |
| Glow | The primary support or resistance; the second ones draw without the glow |
| Small triangle at the left end | The king: the single largest gamma strike |
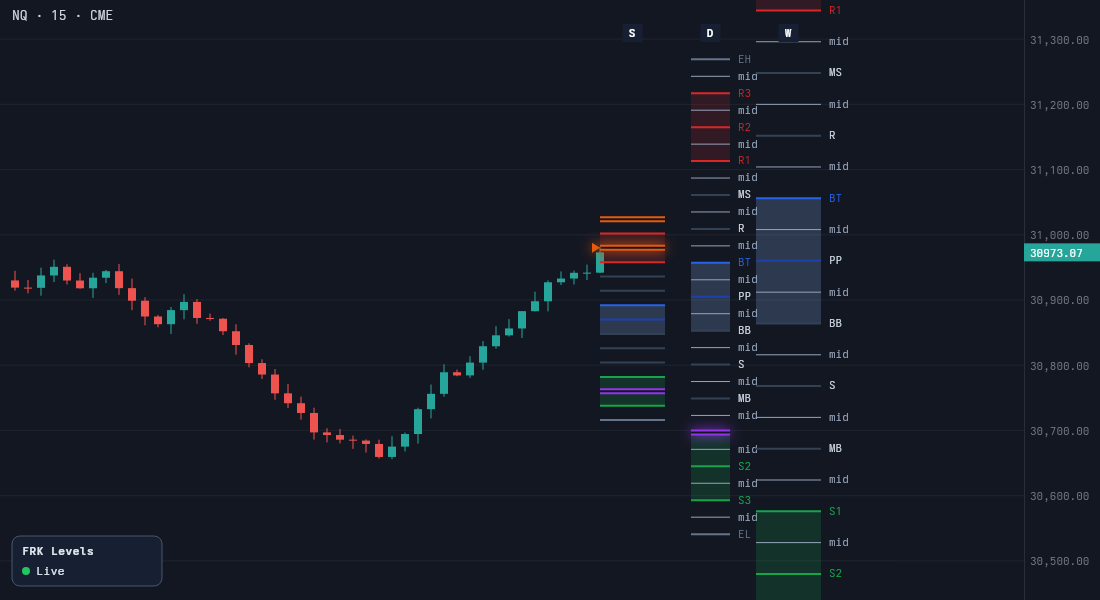
The lines are hollow so you can still read candles through them. GEX updates every few seconds during market hours; when it can't update, the status panel shows Live · GEX offline and the highlights clear.
Expected Move
The Expected Move lines show how far the options market expects price to travel from yesterday's close. They come from the at-the-money straddle priced at the 4:00 pm ET close and stay fixed for the whole session.
| Line | Distance from the prior close | Rough meaning |
|---|---|---|
| +1σ | + 1.25 × straddle | One standard deviation up; about 68% of sessions close inside ±1σ |
| EM Hi | + straddle | The average day's move up |
| EM Lo | − straddle | The average day's move down |
| −1σ | − 1.25 × straddle | One standard deviation down |
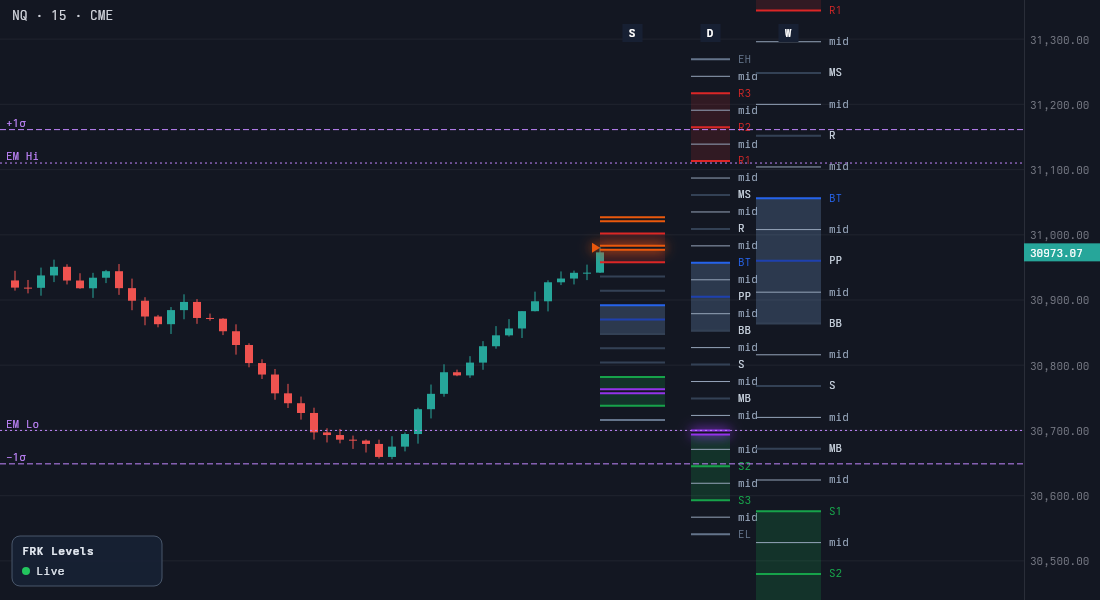
All four are dashed purple lines across the chart, labelled at the left. Price reaching EM Hi or EM Lo means the day has already made a full average move; ±1σ marks an extended day. The percentages assume a normal distribution, and real markets have fatter tails.
On NQ and ES the lines use the futures close; on NDX and SPX they use the index close, so they sit at the right price on both. They show while GEX is live. Turn them off with Expected Move (HI/LO, ±1σ) in the popup.
Volume bubbles
A volume bubble marks a burst of large trading: trades at the same price and side, each within 1 second of the last, added together. Big bubbles at a level show where larger traders stepped in.
| Look | Meaning |
|---|---|
| Teal ring | Buyers lifted the offer |
| Red ring | Sellers hit the bid |
| Grey ring | Side unknown |
| Ring size and number | Total contracts; bigger ring, bigger trade |
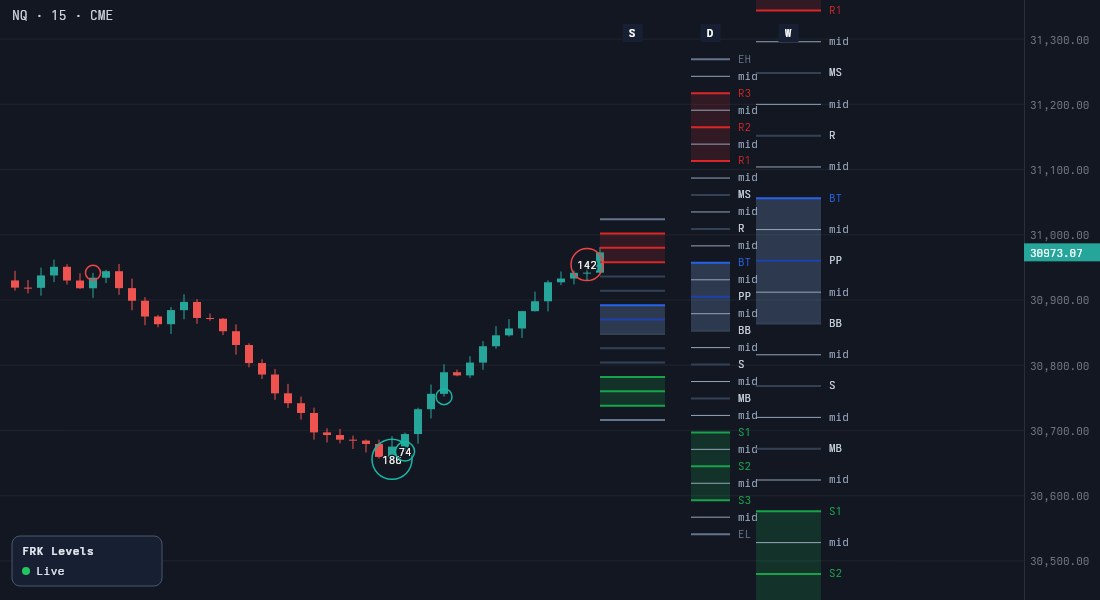
Each bubble sits on the bar where the burst started, at its price. Only the top 10% of bursts this session show, and never fewer than 20 contracts on NQ or 100 on ES. A teal bubble in a buy zone, or a red one in a sell zone, confirms the level is being defended.
Bubbles show on NQ, MNQ, ES and MES futures charts only. Turn them off with Volume bubbles in the popup.
Delta profile
The delta profile shows, at each price, whether buyers or sellers were more aggressive today. It draws as horizontal bars along the right edge of the chart, just left of the price scale.
- Blue bar: more buying than selling at that price.
- Red bar: more selling than buying.
- Bar length: the size of the imbalance; the largest row is 120 pixels long.
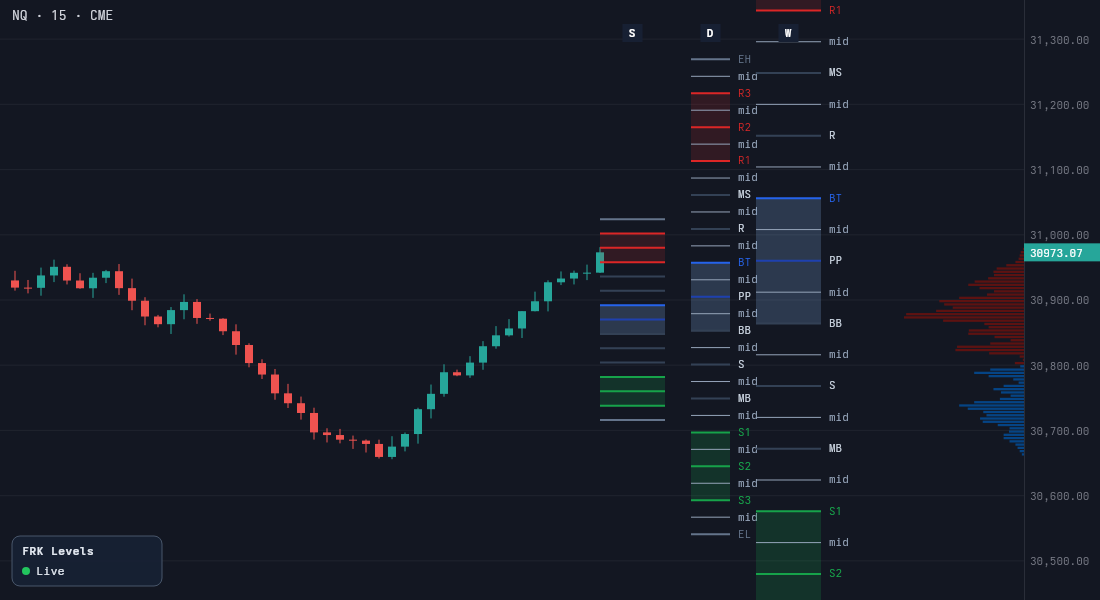
It covers the full session from the 6:00 pm ET open and updates about every 5 seconds. A long red bar under a sell zone shows sellers defending it; a run of blue bars through a level shows buyers absorbing supply.
The delta profile shows on NQ, MNQ, ES and MES futures charts only. Turn it off with Delta profile in the popup.
Settings
Click the FRK Levels icon in Chrome's toolbar to open the popup. Changes apply to every open chart straight away and are remembered.
| Setting | What it does | Default |
|---|---|---|
| Scalp / Daily / Weekly checkbox | Show or hide that frame | On |
| Line style (Solid, Dotted, Dashed) | Line style for that frame's levels | Solid |
| Mids | Show or hide that frame's mid lines | Off for Scalp, on for Daily and Weekly |
| View | All Levels, Simple, Zones or All + Zones | All Levels |
| Volume bubbles | Show large-trade bubbles | On |
| Delta profile | Show the session delta profile | On |
| Expected Move (HI/LO, ±1σ) | Show EM Hi, EM Lo and ±1σ | On |
| Sign out | Ends this browser's session | — |
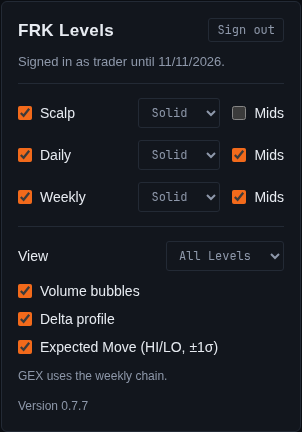
The popup also shows your username, when your session expires and the extension version.
Markets, updates and troubleshooting
| Chart | FRK levels | GEX | Expected Move | Bubbles and delta profile |
|---|---|---|---|---|
| NQ, MNQ, ES, MES futures | Yes | Yes | Yes | Yes |
| NDX, SPX index | Yes | Yes | Yes | No |
| Any other symbol | Yes | No | No | No |
Updating. The popup shows your version at the bottom; the latest is on the Install tab of your account page. To update, download the zip, unzip it over your existing folder, click the reload arrow on FRK Levels in chrome://extensions, then refresh your TradingView tab.
Troubleshooting
- No levels: check the status panel. If it says to sign in, open the popup and sign in.
- "Could not reach FRK" when signing in: a VPN, ad blocker or antivirus web filter is blocking api.frkcharts.com. Turn it off briefly and try again.
- "Invalid username or password": use your username, not your email. Five wrong tries lock the name for 15 minutes; reset your password from the account page.
- Popup says signed in but the chart doesn't connect: reload the extension in
chrome://extensions, then refresh TradingView. - No bubbles or delta profile: they only show on futures charts.
Still stuck? Email support@frkcharts.com.
FRK Levels is a charting tool, not investment advice. Not affiliated with TradingView.